Flow Chart
Description
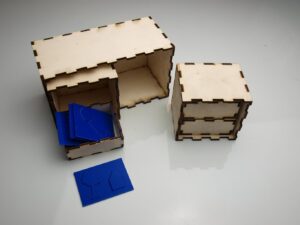
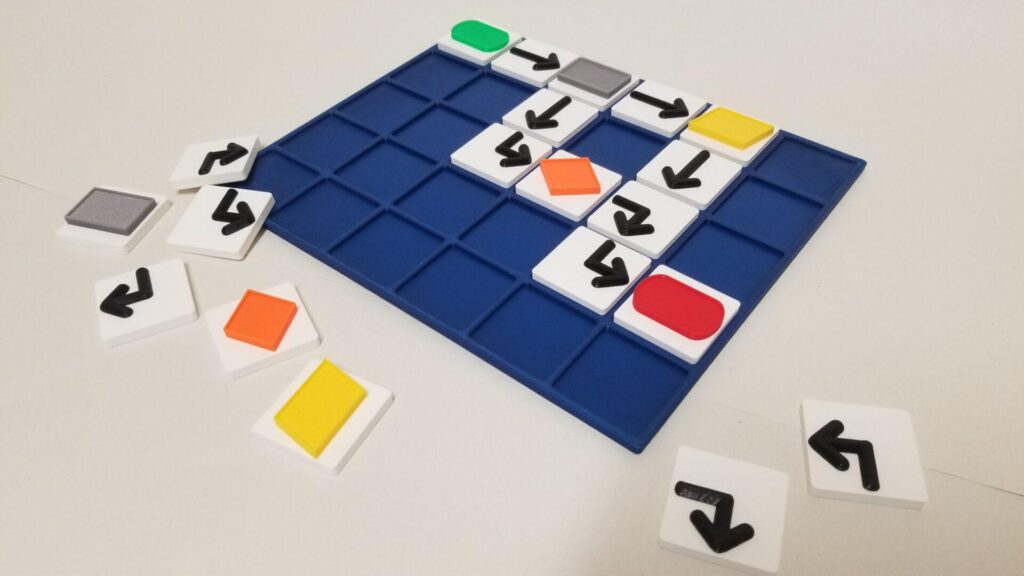
A tactile model of a flow chart. Flow charts are used to graphically represent a process and the choices, decisions or results produced by that process. They can be used in many contexts in order to clarify process. This model was designed and tested as part of the 3D4VIP project.
Printing instructions and tips
The grid can be printed in one run as a single part – it is optimised for the print bed size of a Prusa Mk 3. A layer-based colour change can be included to enhance colour contrast in the topmost layers of the grid. The tiles comprise ovals to indicate start and stop of the process, arrows to indicate directional flow, rectangles to indicate any step in the process, diamonds to indicate a decision in the process and a parallelogram to indicate an input or output. All the tiles are printed with a layer-based colour change. To speed the printing process layer height can be changed to 0.3mm, however 0.1mm is recommended for the uppermost (arrow) part of the arrow tiles to preserve their tactile comfort. Source files can be found here: https://www.tinkercad.com/things/lxSRP2zQcGC
Downloads
- SHARED Flow Chart – Demo (STL)
- Flow Chart Function 2 (STL)
- Flow Chart Function 3 (STL)
- Flow Chart Start Stop (STL)
- Flow Chart Arrows (STL)
- Flow Chart Function 1 (STL)
- Flow Chart Grid (STL)
Bundle of all files listed above.